Admissions data
Admissions data, with the fine print
Every figure is from an official academy or government page, with its class year and source.
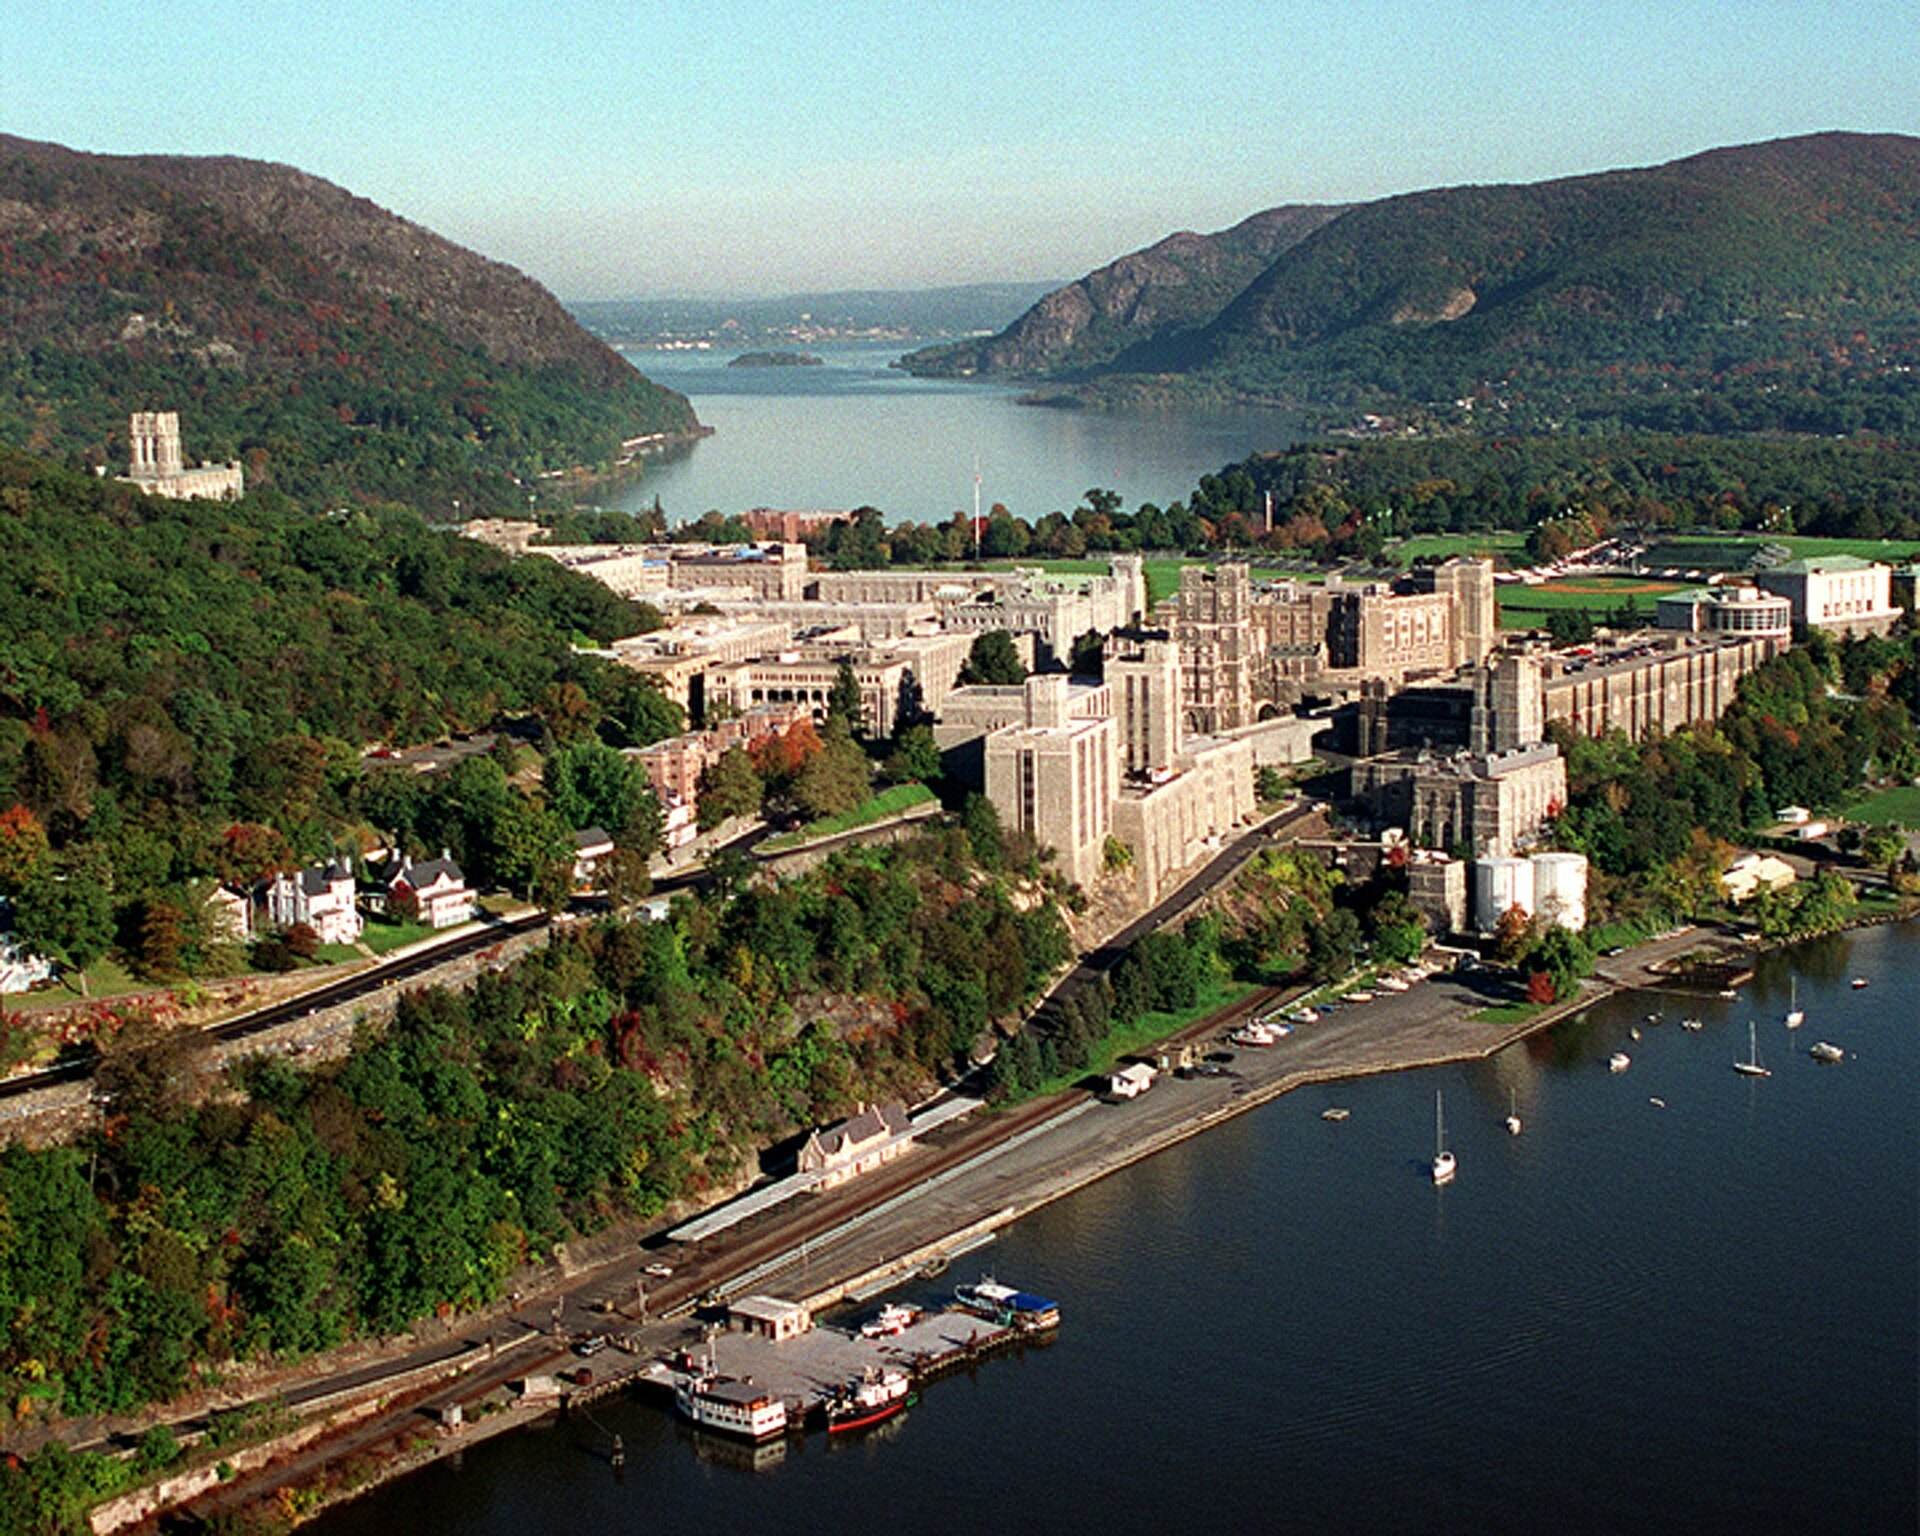
West Point looking north up the Hudson. Photo: USMA Public Affairs Office via Wikimedia Commons, Public domain (U.S. government work).

Acceptance rates
Each academy defines applicants differently, so these rates aren’t a direct side-by-side comparison. How each rate is counted
By academy
USNA
U.S. Naval Academy
Applications and offers Class of 2030
Test scores Class of 2029
| Measure | Value | Class |
|---|---|---|
SAT EBRW, middle 50%i25th-75th percentile, SAT Verbal. | 600-710↗ | Class of 2029 |
SAT math, middle 50%i25th-75th percentile. | 610-720↗ | Class of 2029 |
ACT English + Reading, middle 50%iUSNA lists these as 'ACT equivalent scores' (English + Reading). | 49-66↗ | Class of 2029 |
ACT math, middle 50%iACT equivalent score. | 26-32↗ | Class of 2029 |
| Top 10% of high school class | 60%↗ | Class of 2029 |
Class profile and activities Class of 2030
| Measure | Value | Class |
|---|---|---|
| International students | 14↗ | Class of 2030 |
| Geographic representation | 49 states, plus DC, Guam, Puerto Rico, American Samoa and the U.S. Virgin Islands↗ | Class of 2030 |
Children of alumnii11 have both parents who are USNA alumni. | 73↗ | Class of 2030 |
NAPS graduatesiFrom the Naval Academy Preparatory School; 35 Navy and 7 Marine Corps of these are prior enlisted. | 194↗ | Class of 2030 |
Foundation or civilian prepiU.S. Naval Academy Foundation Program ÷ Civilian Prep Program. | 49↗ | Class of 2030 |
Prior enlistediNavy 45, Marine Corps 11. | 56↗ | Class of 2030 |
Earlier classes 38 figures
| Measure | Value | Class |
|---|---|---|
Applications startediClass Portrait 'Applications: Total'. The AEB report labels this 'Total applications initiated'. | 16,077↗ | Class of 2029 |
Fully qualified applicantsiAEB AY24-25 report. The same report also gives '2600 fully qualified candidates' in its metrics table, which reads as rounded. | 2,577↗ | Class of 2029 |
Application completion rateiPercent of the candidate pool that completed an application. The number of completed applications itself is not published. | 32.6%↗ | Class of 2029 |
| Offers of appointment | 1,416↗ | Class of 2029 |
Entering classiInducted June 26, 2025 (per the 2029 Class Portrait PDF). | 1,197↗ | Class of 2029 |
Admit rate CalculatediCalculated: offers ÷ applications started = 1,416 ÷ 16,077 = 8.81%. The denominator counts started applications, so this rate is lower than an offers-to-completed-applications rate would be. | 8.81%↗ | Class of 2029 |
YieldiPublished 'overall yield rate'. | 84.6%↗ | Class of 2029 |
Nominations by categoryiPublished under 'Nominating Categories' without saying whether these count nominations or nominated candidates. They are not inductee counts. Do not add them up or compare them to the applications figure. | Congressional 5,614 · Presidential 486 · Secretary of the Navy 414 · ROTC/JROTC 340 · Children of deceased or disabled veterans 244↗ | Class of 2029 |
Varsity athleticsiVarsity athletics participation in high school. | 92%↗ | Class of 2029 |
| Team captain or co-captain | 58%↗ | Class of 2029 |
| Worked 10+ hours a week | 55%↗ | Class of 2029 |
| National Honor Society | 54%↗ | Class of 2029 |
| Student body leader | 52%↗ | Class of 2029 |
| Community service | 48%↗ | Class of 2029 |
| Religious group or club | 36%↗ | Class of 2029 |
| Tutor, teacher, mentor or coach | 34%↗ | Class of 2029 |
| ROTC, JROTC, Sea Cadets or CAP | 25%↗ | Class of 2029 |
| Musical activities | 23%↗ | Class of 2029 |
| Scouts | 12%↗ | Class of 2029 |
| School publication | 7%↗ | Class of 2029 |
| International students | 14↗ | Class of 2029 |
| Geographic representation | Every state, plus DC, Guam, Puerto Rico and the U.S. Virgin Islands↗ | Class of 2029 |
From college or prep programsi30% of the class: NAPS 215, Foundation/civilian prep 48, and 99 others with at least one semester of college or post-secondary prep. | 362↗ | Class of 2029 |
| NAPS graduates | 215↗ | Class of 2029 |
| Foundation or civilian prep | 48↗ | Class of 2029 |
| Prior enlisted | 64↗ | Class of 2029 |
Children of alumnii47 sons and 14 daughters of alumni. 9 have both parents who are alumni. | 61↗ | Class of 2029 |
Applications startediMen 10,287, women 4,859. | 15,146↗ | Class of 2028 |
| Applications by sex | Men 10,287 · Women 4,859↗ | Class of 2028 |
Entering classiProjected class size as of June 26, 2024 (I-Day): men 814, women 373. | 1,187↗ | Class of 2028 |
| Entering class by sex | Men 814 · Women 373↗ | Class of 2028 |
Women CalculatediCalculated: women inducted ÷ entering class = 373 ÷ 1,187 = 31.42%. | 31.42%↗ | Class of 2028 |
| International students | 17↗ | Class of 2028 |
| Geographic representation | Every state, plus DC, American Samoa, Guam, Puerto Rico and the U.S. Virgin Islands↗ | Class of 2028 |
Children of alumnii38 sons and 27 daughters. 7 have both parents who are alumni. | 65↗ | Class of 2028 |
NAPS graduatesi37 Navy and 9 Marine Corps of these are prior enlisted. | 209↗ | Class of 2028 |
| Foundation or civilian prep | 42↗ | Class of 2028 |
Prior enlistediNavy 49, Marine Corps 9. | 58↗ | Class of 2028 |
How USNA defines counts
- Applications
- USNA counts 'applications' as applications initiated (started), not completed. The AY24-25 Academy Effectiveness Board report labels the 16,077 figure 'Total applications initiated' and reports a 32.6% application completion rate. ↗
- Offers of appointment
- Offers of appointment extended (published on the Class Portrait). ↗
- Entering class
- Number inducted on Induction Day (I-Day). The I-Day stats pages call it 'projected class size' as of I-Day. ↗
Notes from USNA’s own pages
USNA publishes two things: a full Class Portrait for the Class of 2029, and shorter Induction Day stats for the Class of 2030.
Class of 2030 (entered June 2026). Source: USNA I-Day Stats
All figures are "as of June 25, 2026"1.
| Item | Class of 2030 | Source |
|---|---|---|
| Applications | 16,814 | USNA I-Day Stats |
| Projected class size | 1,204 | USNA I-Day Stats |
| Offers of appointment | Not published on an official source (not on the I-Day stats page) | — |
| International students | 14 | USNA I-Day Stats |
| From Naval Academy Preparatory School (NAPS) | 194 (35 Navy and 7 Marine Corps of them prior enlisted) | USNA I-Day Stats |
| From USNA Foundation / Civilian Prep programs | 49 | USNA I-Day Stats |
| Total prior enlisted | 56 (45 Navy, 11 Marine Corps) | USNA I-Day Stats |
| Children of USNA alumni | 73 (11 with both parents alumni) | USNA I-Day Stats |
| Geography | 49 states, plus D.C., Guam, Puerto Rico, American Samoa, and the Virgin Islands | USNA I-Day Stats |
| Test score ranges, GPA, % women, recruited athletes | Not published on an official source for the Class of 2030 | — |
Computed, and not an admit rate: projected class size ÷ applications = 1,204 ÷ 16,814 = about 7.2%. This is the share of applicants who entered, not the share who got offers, because USNA hasn't published Class of 2030 offers.
Class of 2029 (entered June 2025). Source: USNA Class Portrait
This is the most recent full profile USNA has published. The web page was last updated May 1, 2026 (USNA Class Portrait; same figures in the 2029 Class Portrait PDF).
| Item | Class of 2029 | Source |
|---|---|---|
| Applications | 16,077 | Class Portrait |
| Offers of appointment | 1,416 | Class Portrait |
| Class size (entered on I-Day, June 26, 2025) | 1,197 | Class Portrait; PDF |
| Nominations by category | Congressional 5,614; Presidential 486; Secretary of the Navy 414; ROTC/JROTC 340; Children of Deceased/Disabled Veterans 244 | Class Portrait |
| SAT middle 50% | Verbal 600–710; Math 610–720 | Class Portrait |
| ACT middle 50% ("ACT equivalent scores") | English + Reading combined 49–66; Math 26–32 | Class Portrait |
| Top 10% of high school class | 60% | Class Portrait |
| Varsity athletics | 92% | Class Portrait |
| Captain/co-captain of a sports team | 58% | Class Portrait |
| National Honor Society | 54% | Class Portrait |
| Student body leader | 52% | Class Portrait |
| Work experience (>10 hrs/week) | 55% | Class Portrait |
| From college or post-high-school prep programs | 362 (30%): 215 from NAPS, 48 from USNA Foundation/Civilian Prep, 99 with at least a semester of college or post-secondary prep | Class Portrait |
| Prior enlisted | 64 | Class Portrait |
| International students | 14 | Class Portrait |
| Children of USNA alumni | 47 sons and 14 daughters | Class Portrait PDF |
| High school GPA | Not published on an official source | — |
| % women | Not published on an official source for the Class of 2029 | — |
| Recruited athletes | Not published on an official source | — |
Computed offer rate: offers ÷ applications = 1,416 ÷ 16,077 = 8.8%. Computed: class size ÷ offers = 1,197 ÷ 1,416 = 84.5% of people offered an appointment entered.
USNA's own description of a typical year: "of the 3000 students who fully qualify … 1,400 will receive appointments and approximately 1,200 become midshipmen" (USNA Apply, as recorded in our research on 2026-10-17).
Note on the ACT row: USNA lists the ACT as a combined language-arts + reading range on a different scale from single ACT section scores, and labels them "ACT equivalent scores." Don't compare those numbers directly to a single ACT section score.
USMA
U.S. Military Academy (West Point)
Applications and offers Class of 2030
| Measure | Value | Class |
|---|---|---|
Applicants (press release)iPublished as 'over 13,600 applicants'. Lower bound. | Over 13,600↗ | Class of 2030 |
Entering classiPublished as 'more than 1,230 U.S. citizens and 20 international students' (a lower bound of about 1,250). The same release later says '19 international cadets', so the release contradicts itself. | Over 1,250↗ | Class of 2030 |
Test scores Class of 2028
| Measure | Value | Class |
|---|---|---|
SAT composite (25th · 50th · 75th)iCDS C9. 68% (817) submitted SAT. | 1,210 · 1,330 · 1,420↗ | Class of 2028 |
| SAT EBRW (25th · 50th · 75th) | 600 · 660 · 710↗ | Class of 2028 |
| SAT math (25th · 50th · 75th) | 600 · 670 · 720↗ | Class of 2028 |
ACT composite (25th · 50th · 75th)i32% (378) submitted ACT. | 27 · 31 · 33↗ | Class of 2028 |
Top 10% of high school classiCDS C10. 99% submitted a class rank. | 43%↗ | Class of 2028 |
| Top 25% of high school class | 67%↗ | Class of 2028 |
| Top 50% of high school class | 91%↗ | Class of 2028 |
Average high school GPAiCDS C12. 100% submitted a GPA. The scale may include weighting even though C11 asks for a 4.0 scale (75.57% report exactly 4.0). | 4.1↗ | Class of 2028 |
Class profile and activities Class of 2030
Earlier classes 28 figures
| Measure | Value | Class |
|---|---|---|
Applicants (press release)iPublished as 'over 13,700 applicants'. Lower bound. | Over 13,700↗ | Class of 2029 |
Entering classiPublished as 'more than 1,230 U.S. citizens and 14 international students'. Lower bound. | Over 1,244↗ | Class of 2029 |
| International students | 14↗ | Class of 2029 |
| Geographic representation | Every state, plus DC, Puerto Rico, Guam and the Northern Marianas↗ | Class of 2029 |
Applicants (Common Data Set)iCDS C1, total first-time first-year who applied. Men 8,549, women 3,771. | 12,316↗ | Class of 2028 |
Admitted (Common Data Set)iCDS C1. Men 1,175, women 359. | 1,534↗ | Class of 2028 |
Enrolled (Common Data Set)iCDS C1. Men 931, women 264. | 1,195↗ | Class of 2028 |
Admit rate CalculatediCalculated: admitted ÷ applicants = 1,534 ÷ 12,316 = 12.46%. | 12.46%↗ | Class of 2028 |
Yield CalculatediCalculated: enrolled ÷ admitted = 1,195 ÷ 1,534 = 77.9%. | 77.9%↗ | Class of 2028 |
Women CalculatediCalculated: women enrolled ÷ enrolled = 264 ÷ 1,195 = 22.09%. | 22.09%↗ | Class of 2028 |
Race and ethnicity (first year)i Counts are first-time, first-year degree-seeking students from CDS section B2 (IPEDS categories). Nonresidents are reported separately. | Nonresident 16 · Hispanic or Latino 161 · Black 86 · White 756 · American Indian or Alaska Native 9 · Asian 147 · Native Hawaiian or Pacific Islander 6 · Two or more races 14 · Unknown 0 · Total 1,195↗ | Class of 2028 |
Minority share CalculatediCalculated: U.S. students of color (unknown excluded) ÷ first-year total minus nonresidents and unknown = 423 ÷ 1,179 = 35.88%. Numerator = Hispanic 161 + Black 86 + AI/AN 9 + Asian 147 + NH/PI 6 + Two or more 14. This is our computation. USMA doesn't publish a 'minority share'. | 35.88%↗ | Class of 2028 |
Applicants (Common Data Set)iCDS C1. Men 8,081, women 3,349. | 11,430↗ | Class of 2027 |
Admitted (Common Data Set)iCDS C1. Men 1,263, women 335. | 1,598↗ | Class of 2027 |
Enrolled (Common Data Set)iCDS C1. Men 970, women 240. | 1,210↗ | Class of 2027 |
Admit rate CalculatediCalculated: admitted ÷ applicants = 1,598 ÷ 11,430 = 13.98%. | 13.98%↗ | Class of 2027 |
Yield CalculatediCalculated: enrolled ÷ admitted = 1,210 ÷ 1,598 = 75.72%. | 75.72%↗ | Class of 2027 |
Women CalculatediCalculated: women enrolled ÷ enrolled = 240 ÷ 1,210 = 19.83%. | 19.83%↗ | Class of 2027 |
SAT composite (25th · 50th · 75th)i69% (839) submitted SAT. | 1,220 · 1,330 · 1,420↗ | Class of 2027 |
| SAT EBRW (25th · 50th · 75th) | 600 · 660 · 700↗ | Class of 2027 |
| SAT math (25th · 50th · 75th) | 600 · 670 · 730↗ | Class of 2027 |
ACT composite (25th · 50th · 75th)i31% (371) submitted ACT. | 28 · 31 · 33↗ | Class of 2027 |
| Top 10% of high school class | 41%↗ | Class of 2027 |
| Top 25% of high school class | 69%↗ | Class of 2027 |
| Top 50% of high school class | 92%↗ | Class of 2027 |
| Average high school GPA | 4.03↗ | Class of 2027 |
Race and ethnicity (first year)iThe B2 first-year total (1,173) differs from the C1 enrolled count (1,210) in the same CDS, probably because they were counted on different dates. Counts are first-time, first-year degree-seeking students from CDS section B2 (IPEDS categories). Nonresidents are reported separately. | Nonresident 16 · Hispanic or Latino 137 · Black 106 · White 732 · American Indian or Alaska Native 14 · Asian 143 · Native Hawaiian or Pacific Islander 9 · Two or more races 15 · Unknown 1 · Total 1,173↗ | Class of 2027 |
Minority share CalculatediCalculated: U.S. students of color (unknown excluded) ÷ first-year total minus nonresidents and unknown = 424 ÷ 1,156 = 36.68%. Uses B2 totals: 137+106+14+143+9+15 = 424, and 1,173-16-1 = 1,156. This is our computation, not a USMA figure. | 36.68%↗ | Class of 2027 |
How USMA defines counts
- Press release applicants
- Press releases give a rounded 'national pool of over N applicants' without defining what counts as an applicant. Don't mix these with the CDS figures. ↗
- Cds applicants
- CDS item C1 counts first-time, first-year degree-seeking students who applied, were admitted and enrolled. Under CDS rules, applicants are those who completed the actions required for consideration. 'Admitted' means offered admission (appointment). ↗
Notes from USMA’s own pages
West Point's public figures for the latest class come from its Class of 2030 press release. Its "at a glance" page, which may hold more class-profile data, wasn't available when we checked when we checked on October 17 and 18, 2026, so we couldn't verify anything from it.
| Item | Class of 2030 (Reception Day June 29, 2026) | Source |
|---|---|---|
| Applicants | "over 13,600" | West Point: Class of 2030 to Enter West Point (June 22, 2026) |
| Entering class | "More than 1,230 U.S. citizens and 20 international students" | Same release |
| International cadets | The same release also says "19 international cadets." See the conflict note below | Same release |
| Geography | Every state, plus D.C., Puerto Rico, the U.S. Virgin Islands, Guam, and the Northern Marianas | Same release |
| Offers / admits | Not published on an official source | — |
| Nominations / qualified candidates | Not published on an official source | — |
| SAT/ACT ranges, GPA | Not published on an official source | — |
| % women | Not published on an official source | — |
| Recruited athletes | Not published on an official source | — |
| Item | Class of 2029 | Source |
|---|---|---|
| Applicants | "over 13,700" | West Point: Class of 2029 to Enter West Point |
| Entering class | More than 1,230 U.S. citizens and 14 international students | Same release |
Admit rate: can't be computed. West Point hasn't published an offer count, and both of the numbers it did publish are approximate ("over," "more than").
Conflict: the Class of 2030 release gives "20 international students" in its first paragraph and "19 international cadets" later on. We show both and don't choose between them.
USAFA
U.S. Air Force Academy
Applications and offers Class of 2030
| Measure | Value | Class |
|---|---|---|
ApplicantsiSame figure in the I-Day feature article. | 10,970↗ | Class of 2030 |
| Change in applications | +11% overall applications vs. prior year↗ | Class of 2030 |
Entering classiThe press release says it in-processed 'more than 1,130 appointees', but the I-Day feature and the breakdown say 'more than 1,120'. Both are lower bounds. | Over 1,130↗ | Class of 2030 |
Appointments acceptedi'over 1,130 candidates committing'. Lower bound. | Over 1,130↗ | Class of 2030 |
YieldiOnly a threshold is published. The number of offers isn't, so no admit rate can be computed. | more than 80% of appointments offered were accepted↗ | Class of 2030 |
Traditional applicant commitmentsiUp from 774. 75.8% of offered traditional applicants accepted. | 790↗ | Class of 2030 |
Test scores Class of 2030
| Measure | Value | Class |
|---|---|---|
| Average high school GPA | 3.89↗ | Class of 2030 |
| Top 10% of high school class | 52.8%↗ | Class of 2030 |
| Top 25% of high school class | 82.5%↗ | Class of 2030 |
| Top 50% of high school class | 97.6%↗ | Class of 2030 |
Change in average composite scoreiThe press release says 'seven percent higher'. The admissions article says 'a 7.5 percent increase in the competitive composite score'. | composite scores about 7% (7.5%) higher than previous averages↗ | Class of 2030 |
Class profile and activities Class of 2030
| Measure | Value | Class |
|---|---|---|
Recruited athletes and targeted prospectsiCommitted appointees among 'targeted prospects and recruited student-athletes' (up from 225). That group accepted 95.7% of its offers, up from 87.5%. | 264↗ | Class of 2030 |
| Women | 24.1%↗ | Class of 2030 |
| National Honor Society | 47%↗ | Class of 2030 |
Varsity athleticsiParticipated in high school varsity athletics. 87% earned a letter. | 97%↗ | Class of 2030 |
| Student government | 29.2%↗ | Class of 2030 |
| Band or orchestra | 19%↗ | Class of 2030 |
| Boys State or Girls State | 16%↗ | Class of 2030 |
| JROTC | 16%↗ | Class of 2030 |
| Scouts | 9%↗ | Class of 2030 |
| Civil Air Patrol | 6%↗ | Class of 2030 |
Prep School graduatesiUSAFA Preparatory School graduates. | 15.2%↗ | Class of 2030 |
| Prior enlisted | 4.6%↗ | Class of 2030 |
Children of academy graduatesi7.4% of the class. 68 have a USAFA parent, 17 USMA, 9 USNA and 1 USMMA. 8 have both parents from USAFA and 2 have both from USMA. | 85↗ | Class of 2030 |
| International appointees | 17↗ | Class of 2030 |
Earlier classes 33 figures
| Measure | Value | Class |
|---|---|---|
Entering classiAppointees who took the Oath of Office and began BCT. Men 850, women 262. | 1,112↗ | Class of 2029 |
Recruited athletes and targeted prospectsiPrior-year (Class of 2029) comparison in the 2030 admissions article. 87.5% of that group accepted their offers. | 225↗ | Class of 2029 |
Traditional applicant commitmentsiPrior-year comparison. | 774↗ | Class of 2029 |
Womeni262 of 1,112. | 23.6%↗ | Class of 2029 |
| Average high school GPA | 3.86↗ | Class of 2029 |
SAT averageiAverage, not a range. EBRW 685.6, Math 698.1. | 1,387↗ | Class of 2029 |
ACT averageiEnglish 30.2, Math 30.5, Science 30.5. | 30.4↗ | Class of 2029 |
| Top 10% of high school class | 54.8%↗ | Class of 2029 |
| Top 20% of high school class | 78.2%↗ | Class of 2029 |
| Top 25% of high school class | 84.9%↗ | Class of 2029 |
| Top 50% of high school class | 95.5%↗ | Class of 2029 |
Varsity athleticsi82% earned an athletic letter. | 96%↗ | Class of 2029 |
| International cadets | 12↗ | Class of 2029 |
| Prep School graduates | 171↗ | Class of 2029 |
Legacyi76 have one USAFA-graduate parent. 15 had both parents attend. | 76↗ | Class of 2029 |
Entering classiBasic cadets: 779 men, 331 women, plus 16 international cadets (the article doesn't say whether the 16 are inside the 1,110). | 1,110↗ | Class of 2028 |
| Women | 30%↗ | Class of 2028 |
Minority shareiPublished: '38% are racial and ethnic minorities' (422 cadets). | 38%↗ | Class of 2028 |
Race and ethnicityiSome cadets identify with two or more groups, so the counts overlap. | Asian American 108 · Hispanic or Latino 135 · African American 77 · Pacific Islander 5 · Native American 15 · White 766 · Total minority identifying 422↗ | Class of 2028 |
| Average high school GPA | 3.86↗ | Class of 2028 |
| SAT section averages | EBRW 675.5 · Math 682.5↗ | Class of 2028 |
| ACT section averages | English 29.7 · Reading 30.6 · Math 29.4 · Science 29.8↗ | Class of 2028 |
| Top 10% of high school class | 54.3%↗ | Class of 2028 |
| Top 20% of high school class | 75%↗ | Class of 2028 |
| Top 25% of high school class | 82%↗ | Class of 2028 |
| Top 50% of high school class | 97.1%↗ | Class of 2028 |
Prep School graduatesiThe text then says 'Forty are prior enlisted Airmen'. That most likely means 40 of the prep graduates, but it's ambiguous. | 178↗ | Class of 2028 |
| International cadets | 16↗ | Class of 2028 |
LegacyiOne parent graduated from USAFA. 5 have two graduate parents. | 53↗ | Class of 2028 |
Applicants (Common Data Set)iCommon Data Set 2022–23, item C1 (fall 2022 entry). Men 5,912, women 2,441. | 8,353↗ | Class of 2026 |
Admitted (Common Data Set)iCommon Data Set 2022–23, item C1. Men 963, women 393. | 1,356↗ | Class of 2026 |
Enrolled (Common Data Set)iCommon Data Set 2022–23, item C1. Counted as of the fall reporting date. | 1,056↗ | Class of 2026 |
Admit rate CalculatediCalculated: admitted ÷ applicants in the Common Data Set = 1,356 ÷ 8,353. The CDS counts completed applications. | 16.23%↗ | Class of 2026 |
How USAFA defines counts
- Applicants
- USAFA releases say the class was 'selected from a pool of N applicants' without defining what counts as an applicant. ↗
- Entering class
- In-processing (I-Day) counts. The 'breakdown' articles count basic cadets who took the oath. Some appointees are turned back, so the press-release and breakdown numbers differ. ↗
Notes from USAFA’s own pages
USAFA published detailed Class of 2030 stats in July 2026. Its admissions brochure also has a "Profile of a Typical Cadet Class" with test ranges, but the brochure doesn't say which class it describes.
Class of 2030 (In-processing Day June 24, 2026)
| Item | Class of 2030 | Source |
|---|---|---|
| Applicants | 10,970 | USAFA: Class of 2030 In-processing Day; USAFA press release |
| Appointees in-processed | "More than 1,120" in one USAFA article; "more than 1,130" in the press release (see the conflict note below) | Article; Press release |
| Accepted into the Cadet Wing after Basic Cadet Training (Aug. 5, 2026) | 1,121 | USAFA: The Class of 2030 Earns Place in Academy's Cadet Wing |
| International appointees | 17 | USAFA press release |
| Women | 24.1% of the class | USAFA: The breakdown: Class of 2030 in-processing stats (July 7, 2026) |
| Average high school GPA | 3.89 | Same |
| Class rank | Top 10%: 52.8%; top 25%: 82.5%; top 50%: 97.6% | Same |
| National Honor Society | 47% | Same |
| Varsity athletics | 97% participated; 87% earned an athletic letter | Same |
| Other activities | Student government 29.2%; band/orchestra 19%; Boys/Girls State or Nation 16%; JROTC 16%; Scouts 9%; Civil Air Patrol 6% | Same |
| USAFA Preparatory School graduates | 15.2% | Same |
| Prior enlisted | 4.6% | Same |
| Children of service academy graduates | 85 (7.4%) | Same |
| Offers / appointments offered | Not published on an official source | — |
| Nominations / qualified candidates | Not published on an official source | — |
| Recruited athletes | Not published on an official source | — |
| Class of 2030 SAT/ACT ranges | Not published on an official source | — |
Admit rate: can't be computed. USAFA hasn't published how many offers it made. (The share who entered can't be pinned down either, because the in-processed count is given only as "more than" a number.)
Conflict: two USAFA pages published the same day give "more than 1,120" and "more than 1,130" appointees in-processed. The official count after Basic Cadet Training was 1,121.
"Profile of a typical cadet class" (class year not stated)
From the USAFA admissions brochure "Life at the U.S. Air Force Academy" (PDF metadata shows it was last modified January 2026). The brochure doesn't say which class these figures describe1.
| Item | Middle 50% | Mean |
|---|---|---|
| SAT Evidence-Based Reading and Writing | 650–730 | 685 |
| SAT Math | 650–740 | 698 |
| ACT language-arts section | 27–34 | 30.2 |
| ACT Reading | 29–35 | 31.5 |
| ACT Math | 27–34 | 30.5 |
Also in the brochure: top 10% of high school class 55%; athletic letter 82%; National Honor Society 69%; class or student-body president/vice president 25%; Boys/Girls State or Nation 16%; Scouting 9%1.
How USAFA says it weighs applications: 50% academic composite (grades and SAT/ACT), 20% admissions committee review, 20% extracurricular composite, 5% interview, 5% Candidate Fitness Assessment1.
USCGA
U.S. Coast Guard Academy
Applications and offers Class of 2030
| Measure | Value | Class |
|---|---|---|
Entering classi'Approximately 285 members of the incoming Class of 2030' (U.S. Coast Guard media advisory, June 23, 2026, sent through the USCG's official GovDelivery account). The arrival date was June 29, 2026. | 285↗ | Class of 2030 |
Test scores Year not stated
| Measure | Value | Class |
|---|---|---|
Average applicant fitness score (PFE)iAverage Physical Fitness Exam score of applicants. | 221↗ | Year not stated |
| Top 10% of high school class | 46%↗ | Year not stated |
| Top 25% of high school class | 82%↗ | Year not stated |
| Top 50% of high school class | 99%↗ | Year not stated |
SAT mediansiMedians, not ranges. 'Critical Reading' is a pre-2016 SAT label, which suggests the page is old. | Math 660 · Critical reading 650↗ | Year not stated |
| ACT medians | Math 28 · English 31↗ | Year not stated |
Class profile and activities Class of 2029
Earlier classes 12 figures
| Measure | Value | Class |
|---|---|---|
Entering classi'Approximately 250' arrived June 30, 2025. | 250↗ | Class of 2029 |
Completed applicationsi'Approximately 1,853 students complete the application process'. | 1,853↗ | Year not stated |
| Appointments offered | 368↗ | Year not stated |
Sworn iniIncludes 6 international cadets. | 265↗ | Year not stated |
Admit rate CalculatediCalculated: appointments ÷ completed applications = 368 ÷ 1,853 = 19.86%. Based on undated 'typical class' figures. Don't attach it to a specific class year. | 19.86%↗ | Year not stated |
| CGA Scholars (prep) | 21%↗ | Year not stated |
| Varsity letter | 88%↗ | Year not stated |
| Team captains | 54%↗ | Year not stated |
| Band | 16%↗ | Year not stated |
| Performing arts | 3%↗ | Year not stated |
| Parent served in the military | 41%↗ | Year not stated |
| Plan a technical major | 78%↗ | Year not stated |
How USCGA defines counts
Notes from USCGA’s own pages
USCGA publishes a "Typical Class Profile." The page says the figures are "representative of the qualifications of a typical entering class." It doesn't say which class year1. USCGA doesn't require a congressional nomination, so it has no nomination figures.
| Item | "Typical entering class" (year not stated) | Source |
|---|---|---|
| Completed applications | "Approximately 1,853 students complete the application process" | USCGA Typical Class Profile |
| Appointments offered | 368 | Same |
| Sworn in | 265, including 6 international cadets | Same |
| Attended the CGA Scholars (prep) program | 21% | Same |
| Average applicant Physical Fitness Exam (PFE) score | 221 | Same |
| Class rank | Top 10%: 46%; top 25%: 82%; top 50%: 99% | Same |
| Median SAT | Math 660; Critical Reading 650 | Same |
| Median ACT | Math 28; language-arts section 31 | Same |
| Middle-50% test ranges | Not published on an official source | — |
| Varsity letter / team captain | 88% / 54% | Same |
| Band / performing arts | 16% / 3% | Same |
| Parent served in the military | 41% | Same |
| Plan a technical major | 78% | Same |
| GPA, % women, recruited athletes | Not published on an official source | — |
Computed offer rate (year not stated): appointments ÷ completed applications = 368 ÷ 1,853 = 19.9%. Because the application count is "approximately," treat this as a rough figure. Computed: sworn in ÷ appointments = 265 ÷ 368 = 72.0%.
Class of 2030 (Swab Summer began June 29, 2026): the U.S. Coast Guard's media advisory said "approximately 285 members of the incoming Class of 2030" would arrive2. The academy's athletics department wrote that "of the over 274 incoming men and women, 159 are athletes"3. That athletics page lists incoming athletes by team. It doesn't say they were all recruited, so we don't call them recruited athletes.
Conflict: "approximately 285" (USCG advisory, before arrival) vs. "over 274" (USCGA athletics, swearing-in day). We show both.
Note on terms: "Critical Reading" is the name the College Board used for an older version of the SAT. USCGA's page still uses it.
USMMA
U.S. Merchant Marine Academy
Applications and offers Year not stated
| Measure | Value | Class |
|---|---|---|
Acceptance rate (published)iA range shown on the admissions page with no class year and no definition of applicants. It's a published rate, but it isn't tied to a class. | 27-32%↗ | Year not stated |
Test scores Class of 2029
Class profile and activities Class of 2029
Earlier classes 4 figures
| Measure | Value | Class |
|---|---|---|
Entering classi'285 Class of 2030 Reporting for INDOC'. Indoctrination began July 9, 2026. | 285↗ | Class of 2030 |
Entering classiPlebe candidates welcomed July 3, 2025. | 281↗ | Class of 2029 |
Entering classiPlebe candidates who arrived July 5, 2024. | 300↗ | Class of 2028 |
| Geographic representation | 45 states and territories, plus the Republic of the Marshall Islands↗ | Class of 2028 |
Notes from USMMA’s own pages
USMMA publishes very little class-profile data on its own site. It is run by the Department of Transportation, and only congressional nominations count1.
| Item | Figure | Class year | Source |
|---|---|---|---|
| Acceptance rate | "27-32% Acceptance Rate" (stated by USMMA) | Not stated | USMMA Admissions |
| Entering class | "285 Class of 2030 Reporting for INDOC" | Class of 2030 (INDOC began July 9, 2026) | USMMA Admissions; Class of 2030 Appointees |
| Typical class size | "Approximately 280 candidates enter USMMA each year" | Typical year | USMMA Selection Process |
| Entering class | 281 plebe candidates from 45 states and territories | Class of 2029 (July 3, 2025) | USMMA: Welcomes Class of 2029 |
| Average SAT | Math 632; Verbal 632 | Class of 2029 | USMMA: Welcomes Class of 2029 |
| Recommended class rank | "ideally rank in the top 20%" (a guideline, not a statistic) | — | USMMA Academic Requirements |
| Applicants, nominations, offers | Not published on an official source | — | — |
| SAT/ACT middle-50% ranges, GPA | Not published on an official source | — | — |
| % women, recruited athletes | Not published on an official source | — | — |
Admit rate: USMMA states "27-32%" itself. We didn't compute one because USMMA doesn't publish applicant or offer counts.
How selection works: fully qualified candidates go on a state-based order-of-merit list and are appointed in rank order to fill each state's yearly allocation. Highly competitive candidates may get conditional offers as early as September2.
Compare the five
| Academy | Acceptance rate | Basis | Class | Counts used | Source |
|---|---|---|---|---|---|
| USNA | 8.8% | Calculated | Class of 2029 | Offers ÷ applications started (1,416 ÷ 16,077) | USNA Class Portrait |
| West Point | 12.5% | Calculated | Class of 2028 | Admitted ÷ applicants in the Common Data Set (1,534 ÷ 12,316) | USMA Common Data Set 2024–25 |
| USAFA | 16.2% | Calculated | Class of 2026 | Admitted ÷ applicants in the Common Data Set (1,356 ÷ 8,353) | USAFA Common Data Set 2022–23 |
| USCGA | 19.9% | Calculated | Year not stated | Appointments ÷ completed applications (368 ÷ 1,853) | USCGA Typical Class Profile |
| USMMA | 27–32% | Published | Year not stated | Range published by USMMA | USMMA Admissions |
Each academy defines applicants differently, so these rates aren’t a direct side-by-side comparison.
Most recent official figures. "NP" = not published on an official source. Check the sections above for exact wording, class years, and caveats.
| USNA | West Point | USAFA | USCGA | USMMA | |
|---|---|---|---|---|---|
| Latest class with official numbers | 2030 (I-Day stats); 2029 (full portrait) | 2030 (press release) | 2030 (in-processing stats) | Year not stated ("typical") | 2030 (entering count); 2029 (SAT) |
| Applicants | 16,814 (2030); 16,077 (2029) | "over 13,600" (2030) | 10,970 (2030) | ~1,853 completed (year not stated) | NP |
| Offers / appointments | 1,416 (2029); NP for 2030 | NP | NP | 368 (year not stated) | NP |
| Entering class | 1,204 projected (2030); 1,197 (2029) | "more than 1,230" U.S. + 20 intl (2030) | 1,121 after BCT (2030) | 265 sworn in (year not stated); ~285 per USCG advisory (2030) | 285 (2030) |
| Offer/admit rate | 8.8% computed (2029) | Can't compute | Can't compute | 19.9% computed (year not stated) | "27-32%" stated (year not stated) |
| SAT | Middle 50%: V 600–710, M 610–720 (2029) | NP | Middle 50%: ERW 650–730, M 650–740 (class not stated) | Median: M 660, CR 650 (year not stated) | Average: M 632, V 632 (2029) |
| ACT | "Equivalent" middle 50%: combined 49–66, Math 26–32 (2029) | NP | Middle 50%: Math 27–34, Reading 29–35 (class not stated) | Median: Math 28 (year not stated) | NP |
| High school GPA | NP | NP | 3.89 average (2030) | NP | NP |
| Top 10% of class | 60% (2029) | NP | 52.8% (2030) | 46% (year not stated) | NP |
| Women | NP | NP | 24.1% (2030) | NP | NP |
| Recruited athletes | NP | NP | NP | NP (159 "athletes" per the athletics site, 2030) | NP |
| Varsity athletics | 92% (2029) | NP | 97% participated (2030) | 88% varsity letter (year not stated) | NP |
| Nomination required? | Yes | Yes | Yes | No | Yes (congressional only) |
Why you can't line these up perfectly: the academies count different things. Some report "applications," some report "completed applications." Some give medians, some middle-50% ranges, some averages. Some name the class year and some don't. Use the table to get a feel for the numbers, not to rank the schools against each other.
What these numbers mean
These are big numbers, but they don't describe you. Thousands of people start an academy application. Far fewer finish every step: nomination (at four of the five academies), medical exam, fitness test, interview, and a complete file. USNA itself says that of the students who apply, roughly 3,000 "fully qualify" in a typical year1. Getting all the way through is already an achievement.
A low admit rate doesn't mean a closed door. It means the academies are looking for people who are well-rounded: academics, athletics, leadership, and character. Look at how many admitted students played varsity sports (92% at USNA for 2029, 97% at USAFA for 2030), led a team or club, or held a job. Those percentages show the academies value the whole person, not just test scores.
Test ranges are a guide, not a cutoff. A middle-50% range means a quarter of the class scored below that range. Scores inside or above a range don't guarantee anything, and scores below it don't rule you out. The academies look at your whole record.
There's more than one road in. Many midshipmen and cadets didn't come straight from high school. At USNA, 30% of the Class of 2029 came through prep programs or some college2. At USAFA, 15.2% of the Class of 2030 came from the Prep School3. At USCGA, 21% of a typical class went through the CGA Scholars program4. A "not this year" can become a "yes" later.
Apply widely. Many candidates apply to more than one academy, and to more than one nomination source, as well as to ROTC programs and other colleges. That's smart planning, not a lack of commitment.
No guarantees, from anyone. No website, coach, consultant, or statistic can promise an appointment. Only the academies decide. We share these numbers so you know what's possible and can prepare well, not to predict anyone's result.
Methodology, gaps and conflicts
How many people apply? How many get offers? What did the last class look like? Every number below comes straight from an official academy or government page. Each one is labeled with its class year and linked to its source. When an academy hasn't published a number, we say "not published on an official source" rather than guess.
Last checked: October 18, 2026. Academies update these pages every year, so always confirm on the official page before you rely on a number.
How to read this page
- Class of 20XX means the year that class graduates. The Class of 2030 entered in summer 2026.
- Applicants are counted differently from academy to academy (applications started, files completed, and so on). Compare them with care.
- Offers (also called appointments) are not the same as the entering class. Some people who get offers choose to go elsewhere.
- Computed means we did the arithmetic ourselves from official figures. We show the math. When the academy itself states a rate, we quote it.
- Middle 50% means half of the class scored inside that range: a quarter scored below it and a quarter scored above it.
Gaps and conflicts in the official data
- Not published officially
- Class of 2030 offers (USNA, West Point, USAFA, USMMA); West Point test scores, GPA, % women, and recruited athletes; USNA % women and GPA; USCGA % women and GPA; USMMA applicants, offers, test ranges, and % women; recruited-athlete counts at all five academies.
- No class year stated
- the USAFA "typical cadet class" brochure figures, the USCGA "Typical Class Profile," and the USMMA "27-32% Acceptance Rate."
- Conflicts
- West Point Class of 2030 international cadets (20 vs. 19, same release); USAFA Class of 2030 in-processed (more than 1,120 vs. more than 1,130); USCGA Class of 2030 arrivals (approximately 285 vs. over 274).
- Couldn't access
- West Point's "at a glance" page.
Data compiled Oct 18, 2026. Figures are never a prediction of anyone’s result. No one can guarantee an appointment.